YeahNah
A site that scores how heavy New Zealand's websites are, built to be about 250 times lighter than the typical site it scores.
- 9 KBan average page, the whole page
- 2.25 MBthe typical site it scores
- 0web fonts, photos or cookies


Who it's for
People who run, build or pay for New Zealand's biggest websites, and anyone curious how their bank or power company stacks up. Most arrive on a phone, from a link someone shared, and give it a few seconds.
To see the verdict straight away.
So every result leads with a grade and one figure: an average page view, in MB.
To trust the numbers.
So the method is published in full, every figure is dated, and nothing is shown that wasn't measured.
Something to do about it.
So each result lists what would make that website lighter, file by file.
The proposition
Scoring New Zealand's websites, on a website that practises what it measures.
First screen
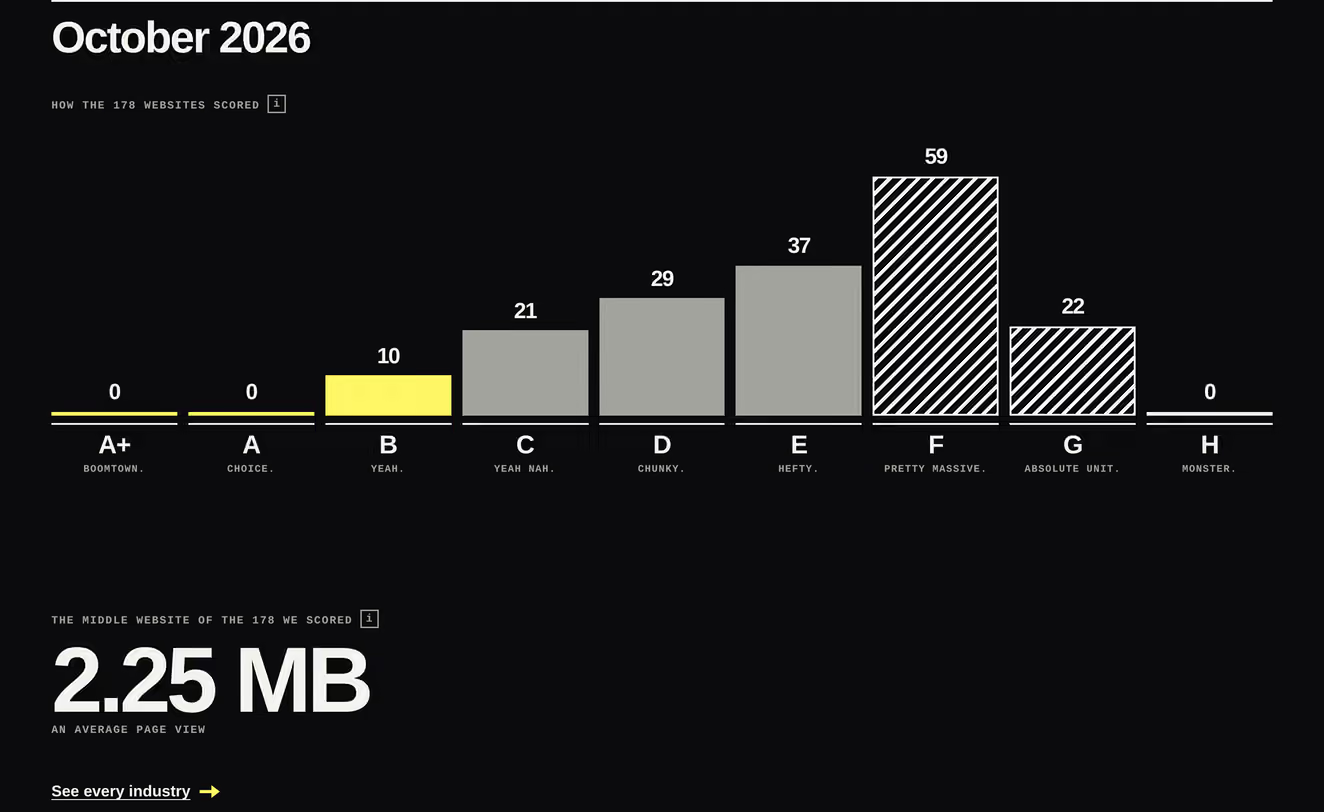
How every website scored this month, from A+ to H, with the middle website's figure under it. The whole story in one glance, before any scrolling.
Each result
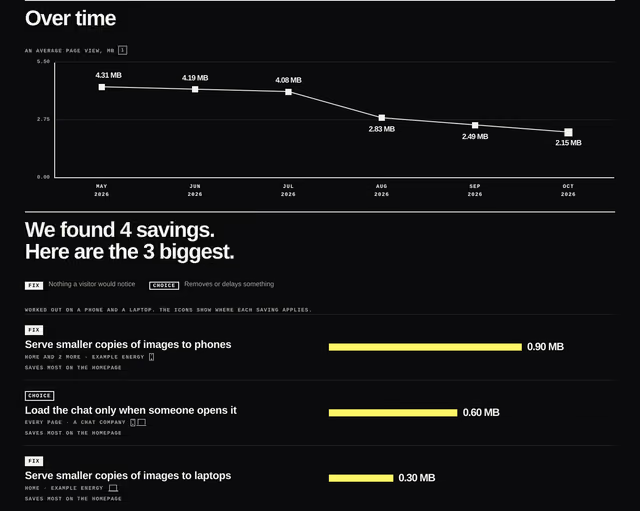
A grade, a figure, a month-by-month chart and the savings that would help, all on a page smaller than one photograph on most of the sites it scores.
Every page
Under 10 KB, or 20 KB for a result with its charts. Not a target: a limit the site is not allowed to break.
01 · Performance
Results
Average page
9 KB
The mean of all 234 pages, 4 November 2026.
Heaviest page
11.7 KB
Of all 234 pages, 4 November 2026.
Homepage
6.7 KB
4 November 2026.
Browser protections
6 of 6
The six security settings browsers look for, which stop other sites hijacking or framing the page.
4 November 2026
02 · Sustainability
Compared with the typical site
YeahNah 9 KB Typical website 2.25 MB
Per page view. The typical figure is the middle website of those YeahNah scored in October 2026, as its homepage shows.
Carbon per page view
YeahNah 0.0014 g Typical website 0.33 g
Ranked first of the 50 lowest-carbon websites on DigitalCarbon.Online's list, November 2026.
Carbon worked out with the Sustainable Web Design v4 model, global grid figures, from each page's average weight.
The brief
YeahNah started as an exercise we set ourselves. Could we build a website that was credible, enjoyable and full of real data, and make it as small as a website can possibly be? Not a bit lighter than average: many times smaller than any of the websites it scores. That ruled out the usual toolkit before anything was drawn. No photographs, no web fonts, no chart library and no framework sent to the browser. Every page had to fit in 10 KB, or 20 KB for a result with its charts. So we had to rethink how a website is made.
The decisions we made, and why
- 01.
A limit the build enforces.
Every page has a weight limit: under 10 KB, or 20 KB for a result page with its charts. The check runs on every build, and anything over it stops the release. It isn't a target we hit once. It's a rule the site can't break.
- 02.
Drawn in code, not pictures.
The lightning bolt, the grade bars and the arrows are shapes drawn in a few lines of CSS. The month-by-month chart is a handful of positioned points and a single line, with the same figures in a table for screen readers. Apart from its small icon, the homepage has no image files at all.
- 03.
The reader's own fonts.
Text is set in Helvetica, or the closest font already on the device, so not one byte of font is downloaded. The only font file in the project is used once, at build time, to draw the pictures that appear when a page is shared. It never reaches a visitor.
- 04.
Compressed once, as hard as it goes.
Normally a server squeezes each page on the fly, quickly and only moderately. We compress every file once, when the site is built, at the strongest settings, and send those exact bytes. A returning browser can also use the page it already has to decode the next one, so a repeat visit sends even less.
- 05.
Every byte earns its place.
The stylesheet is cut down to the rules the pages actually use, with the names inside it shortened. The only scripts are a few lines for the copy buttons and a few more that count visits. Those replaced the usual analytics script: they send Plausible the same figures, without cookies, and made every page about 2 KB lighter. No cookies means no banner.
- 06.
Honest numbers, or none.
A figure that wasn't measured is never shown as a guess or a zero; the page leaves it out. Every result carries its month, and the method behind it is published in full.
Around the site
YeahNah has a page for each industry and each organisation it scores. Every one keeps to the same limit.

What changed
29 September 2026
The idea, written down: what to measure, how to grade it fairly, what it would cost to run, and the limits we'd declare before anyone asked.
1 October 2026
The first build: the homepage and an example result, with the 10 KB weight check in place from the very first commit.
6 October 2026
Work began on our measuring bot, which visits each website as a phone and a laptop would, the same way every time.
23 October 2026
The first industries went live: banks and supermarkets, every figure checked against the bot's own audit before it could be published.
31 October 2026
Seventeen industries live, and every file now compressed once, at build time, at the strongest settings, so each page sends fewer bytes.
4 November 2026
Every page made about 2 KB lighter, by swapping the usual analytics script for a few lines of our own that send Plausible the same figures.